Money can be viewed as a measure of resources being used to achieve our well-being. In this sense, it belongs as part of this post on ways we measure our budget (or resource use) for achieving sustainable well-being. On the other hand, we see relationships between health and income/wealth equality that suggest that relative wealth (after a certain minimum) is more important than absolute wealth. The message here is hopeful because it suggests that we can achieve high well-being at lower overall wealth if we ensure relatively equal distribution of that wealth (and, by implication, other resources). Furthermore, there’s an interesting non-governmental solution…see Dan Pallotta’s Ted Talk).
This animated video from Hans Rosling describes the relationship between health (as indexed by life expectancy) and absolute wealth for the past 200 years.
One of the interesting aspects of the presentation is the clear importance of the industrial revolution in increasing wealth, a revolution that was able to convert fossil fuels into productive work, that has evolved into a culture that still depends on cheap energy for its wealth. Hans’ optimism that the line keeps going up is hard to justify without a discovery of cheap energy to replace carbon fuels. The point, though, is whether there actually is enough wealth for everyone to keep improving in the way Hans depicts. The classic book, The Limits To Growth (and it’s update) is relevant here where the strong scenario in which people live lifestyles that overshoot the carrying capacity of the planet results in collapse (related post on societal collapse).
One way of looking at the above research is that overall wealth is very important at lower levels, but there is also research suggesting that many health-related outcomes are not related to wealth per se, but rather to the distribution of that wealth. The greater the inequality in a country, the worse off the country is in a variety of measures, including health. This research, in terms of income inequality, is reviewed and summarized in The Spirit Level: Why Greater Equality Makes Societies Stronger by Richard Wilkinson and Katie Pickett. This TED talk, by Richard Wilkinson, also reviews some of the research:
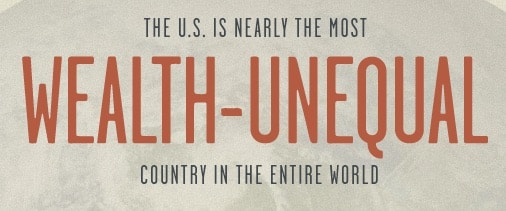
This talk, given by Robert Reich (former labor secretary under Bill Clinton) in 2005, discusses the issue of wealth vs. wealth distribution caused, in part, by globalization and technology. And, this 2015 OECD report (and a summary of it from the Washington Post) goes into detail about wealth inequality which is significantly higher than income inequality.
Current levels of inequality are similar to those seen in the 1880s & 1890s, time periods which kicked off an era of reform (1900-1930s). See 14:25 minutes into the talk for chart showing that 1979 is the start of recently growing income inequality and comments about how much social mobility has suffered in 30 years.
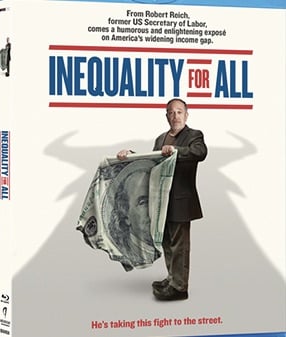
Democracy is difficult to pull off as one society becomes split into separate societies (due to disparities in wealth), risking the politics of resentment, the inability to form a coherent vision of fairness, and class warfare. At the same forum in 2012, Robert Reich discusses the structural changes necessary to reverse the deleterious impact of concentrated wealth on our democracy (e.g., super-PACs dominated by a few people; the politics of resentment; lack of equal opportunity; the rapid demise of CA public higher education due to budget cuts; the Wall Street crisis). He ends by emphasizing that citizens must organize, energize, and mobilize to ensure these necessary structural changes are achieved. Also, this episode of Democracy Now from September 13, 2013 features a conversation with Robert Reich and introduces the film, “Inequality for All” (the website has an excellent graphics package you can download), featuring Robert Reich.
A 2016 Oxfam report found that the top 1% of the world’s population have as much wealth (read “resources”) as the rest of the 99%. Another fact: the 62 richest people in the world have as much wealth as the poorest 3.5 billion people in the world (source).
In terms of the current wealth distribution in the U.S., Forbes reports the following income and wealth for the richest 1% compared to the average American as of March, 2012: The average income of the 1% is $717,000 with wealth of $8.4 million which compares to $51,000 income for the average American (they don’t report wealth, but say that $8.4 million is 70 times the wealth of the “lower” classes; see this similar article from Forbes for World wealth). Also, see this article for alternate ways of calculating wealth and thus, different thresholds for what is considered the 1%. 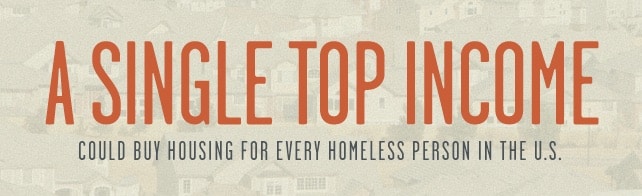
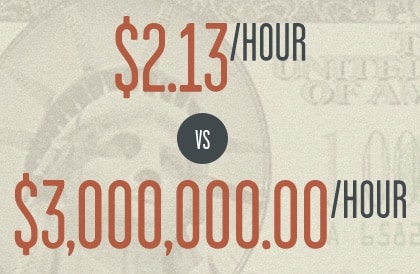
They go further in analyzing the top 1% of the top 1% who have incomes of about $27 million dollars per year. A recent study (Norton Ariely) has shown that Americans vastly underestimate the inequity in wealth distribution and prefer a much more distributed ideal, as illustrat ed by the graph below (and, below that, an amazing animated version of this point in a 6 min video).

These data are consistent with a historical trend identified by Thomas Piketty in his book, “Capital in the 21st Century“, — rates of return on capital outstrip growth, thereby leading to increasing levels of wealth concentration for the 1%.
In any case, if we divide the world’s wealth by the world’s population, we can get a rough estimate of how much wealth we’re entitled to as individuals. Credit Suisse writes a yearly report that tries to quantify household wealth. Based on their October, 2012 report, total world wealth now stands at $223 Trillion. World population is estimated monthly by the US Census Bureau’s population clock. In October of 2012, they estimated world population as 7 Billion, 43 Million people (~7,042,755,609). Wealth per person is $31,664 and the following for different family sizes: 2-person family=$63,327; 3-person family=$94,991; 4-person family=$126,655; 5-person family=$158,319; 6-person family=$189,982. Note that this is wealth, not income. If we take the increase in wealth in the U.S. from 2000 to 2016 (including the 2008 recession) — wealth increased from $44 trillion to $90 trillion, this equates to an increase in wealth of $4 million per household of 4 (source).
If we look at income, this BBC news article calculates that as of March, 2012, the average income is about $10,000 per year. Limited to adults and those with a job, average yearly income is $18,000 or about $1,480 a month. But, it seems to me, that a just income would mean including all adults, and if we include children, all we need do is add that income to the adult in the household. So, in other words, we might approach equity if we had lifestyles based on incomes of $10,000 per year for a single adult, $20,000 per year for a two-adult household, and $40,000 per year for a family of four.
There is an argument to be made that we should distribute resources unequally to those with more desirable traits (e.g., intelligence, creativity) because they are more likely than others to improve the world by using those resources. However, much of success is probably due to luck and that worldview would probably shift our thinking about how resources are distributed.
See this post on Rethinking Money for thoughts about local money and complementary currencies.
For an interesting idea for non-governmental solutions to various problems that are difficult to monetize, see this post about non-profit work and fundraising, in particular.
And, you can also check out this documentary, called Park Avenue: Money, Power and the American Dream. It can be found on Netflix.
Pingback: Our Budget: Ways of Measuring Our Impact | Sustainable Well-being
Pingback: Rethinking Money | Sustainable Well-being
Pingback: Non-profits & fundraising | Sustainable Well-being
Pingback: Transition Introduction | One Planet Thriving
Pingback: Societal Collapse: Volatility and Resilience | One Planet Thriving
Pingback: Chris Hedges: The Imperative of Revolt | One Planet Thriving
Pingback: The United States of Oligarchy? | One Planet Thriving
Pingback: Sustainable well-being: The Big Picture | One Planet Thriving
Pingback: Trump and Societal Collapse | One Planet Thriving